
Ealing's average home rose 0.8% in a year to £585,216, the first annual rise since March. Semis and terraces led; flats still fell. London as a whole fell 3.3%.
The average Ealing home was worth £585,216 in July, up 0.8% on a year earlier. That is a rise of £4,895 in twelve months, and the first annual increase in the borough since March.
The figures come from the UK House Price Index for July 2026, which HM Land Registry published on 16 September. The index is a mean average of completed sales, adjusted for the mix of homes sold. It is not a median and it is not an asking price.
Ealing is now running well ahead of London. The capital’s average fell 3.3% over the same year, to £550,037.
What rose and what fell
Houses did the rising. Flats did not. Here is the year to July, by property type:
- semi-detached, £887,458, up 2.8%
- terraced, £711,468, up 2.7%
- detached, £1,411,890, up 2.0%
- flat or maisonette, £407,789, down 1.0%
The first-time buyer average is £490,320, up 0.6%. Buyers with a mortgage paid an average of £585,541, up 0.9%. Cash buyers paid £584,302, up 0.5%.
Why the number flipped so fast
In our June report, Ealing was down 2.7% on the year. One month later it is up 0.8%. Two things explain most of that swing.
July was a strong month. The average rose 2.0% between June and July, from £573,851 to £585,216.
July 2025 was a weak one. A year ago, the average fell 1.9% in a single month, from £591,601 in June 2025 to £580,321 in July 2025. So this year’s July is being compared with a lower starting point than June was.
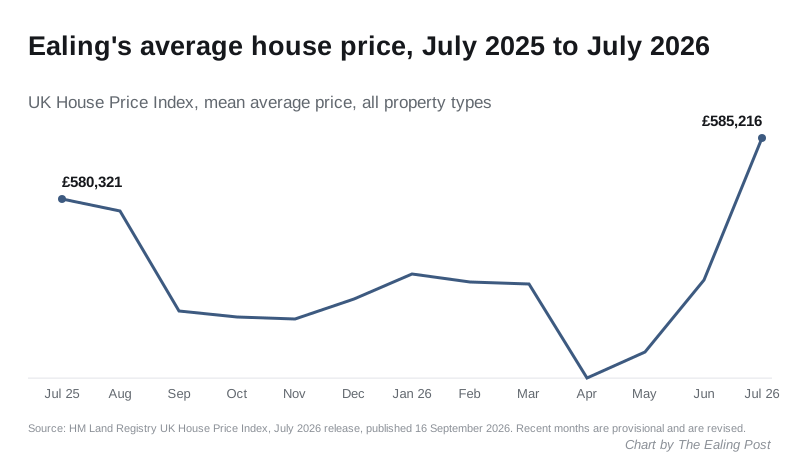
Treat the latest month with care. The index does not yet carry a sales count for June or July, because many of those sales have not reached the Land Registry. The last month with a count is May 2026, with 127 sales, against 287 in July 2025. Fewer sales mean a noisier average, and the most recent months are revised as late sales arrive.
Ealing against its neighbours
Ealing ranked 8th of the 33 London local authorities on annual change in July. Only 12 of the 33 recorded a rise. Here is how the borough compares with the areas around it:
| Area | Average price | Change on a year |
|---|---|---|
| Hounslow | £525,435 | +1.7% |
| Ealing | £585,216 | +0.8% |
| Hillingdon | £470,875 | -1.3% |
| Brent | £546,135 | -2.6% |
| Harrow | £526,493 | -2.8% |
| London | £550,037 | -3.3% |
| Hammersmith and Fulham | £738,048 | -9.0% |
| England | £293,479 | +1.1% |
The biggest risers in London were Barking and Dagenham (+5.3%), Kingston upon Thames (+3.3%) and Waltham Forest (+2.8%). The biggest falls were all in central London, led by Westminster (-20.7%) and the City of London (-17.4%).
Correction to our June figures
The June numbers we published on 20 August have been revised in this release. We reported an average of £575,814, down 2.7%. The Land Registry now puts June at £573,851, down 3.0%. Revisions like this are normal as late sales are added.
What it means for you
If you own a house in Ealing, the index says typical values have edged back up over the year, with semis and terraces up almost 3%. One strong month is not a trend, and July will be revised.
If you are buying a flat, prices are still slightly lower than a year ago, down 1.0% to £407,789.
If you are a first-time buyer, the average price you face is £490,320, barely changed on a year ago.
If you are selling, local sold prices matter more than a borough average. Our Ealing house prices page has the longer picture.
Sources
- HM Land Registry, UK House Price Index, Ealing, July 2026, published 16 September 2026, for the average price, annual and monthly change, property type, buyer type and first-time buyer figures.
- HM Land Registry UK House Price Index monthly records for Ealing, July 2025 to June 2026, for the monthly series, the sales counts and the revised June figure. For example, June 2026 and July 2025.
- HM Land Registry UK House Price Index, July 2026, for all 33 London local authorities, London and England. The ranking is our own.
Have your say